

Home Blog Page 439

National Bank for Agriculture and Rural Development (NABARD)

0
National Bank for Agriculture and Rural Development

National Bank for Agriculture and Rural Development is set up as an apex Development Bank with a mandate for facilitating credit flow for promotion and development of agriculture, small-scale industries, cottage and village industries, handicrafts and other rural crafts. It also has the mandate to support all other allied economic activities in rural areas, promote integrated and sustainable rural development and secure prosperity of rural areas. In discharging its role as a facilitator for rural prosperity National Bank for Agriculture and Rural Development is entrusted with

  1. Providing refinance to lending institutions in rural areas
  2. Bringing about or promoting institutional development and
  3. Evaluating, monitoring and inspecting the client banks

Read Also: Solid Waste Management (SWM) : Growing for Solutions

Besides this pivotal role, National Bank for Agriculture and Rural Development also:

  • Acts as a coordinator in the operations of rural credit institutions
  • Extends assistance to the government, the Reserve Bank of India and other organizations in matters relating to rural development
  • Offers training and research facilities for banks, cooperatives and organizations working in the field of rural development
  • Helps the state governments in reaching their targets of providing assistance to eligible institutions in agriculture and rural development
  • Acts as regulator for cooperative banks and RRBs
  • Extends assistance to the government, the Reserve Bank of India and other organizations in matters relating to rural development
  • Offers training and research facilities for banks, cooperatives and organizations working in the field of rural development
  • Helps the state governments in reaching their targets of providing assistance to eligible institutions in agriculture and rural development
  • Acts as regulator for cooperative banks and RRBs

Read Also: Few Facts About Reserve Bank of India

Some of the milestones in National Bank for Agriculture and Rural Development’s activities are:

  • Total production credit disbursed at end March 2011 was 34196 crore.
  • Refinance disbursement under Investment Credit to commercial banks, state cooperative banks, state cooperative agriculture and rural development banks, RRBs, and other eligible financial institutions during 2010-11 aggregated 13485.87 crores.
  • Through the Rural Infrastructure Development Fund (RIDF) 12060.04 crores were disbursed during 2010-11. A cumulative amount of 121488.40 crores has been sanctioned for 444162 projects as on 31 March 2011 covering irrigation, rural roads, and bridges, health and education, soil conservation, drinking water schemes, flood protection, forest management etc.
  • Under Watershed Development Fund which has a balance of 1847.69 crores as on 31 March 2011, 579 projects in districts of 14 states have benefited.
  • Farmers now enjoy hassle free access to credit and security through 1009.30 lakh Kisan Credit Cards that have been issued through a vast rural banking network. During 2010-11, 72.6 lakh KCC were issued by banks with a sanctioned limit of 43370 crores.
  • Under the Farmers’ Club Programme, during the year 21903 clubs were launched, taking the total to 76708 clubs as on 31 March 2011 helping farmers get access to credit, technology and extension services.
  • Village Development Programme (VDP) is being implemented in 801 villages across 25 states.
  • Under Tribal Development Fund, cumulative sanction amounted to 917.60 crores for 317 projects covering 2.5 lakh families. During 2010-11 financial assistance of 373.97 crores was sanctioned for 126 projects benefiting 94,163 tribal families.
  • Under Farm Innovation and Promotion Fund (FIPF), cumulatively 123 projects in various states, involving financial support of 11.65 crores were sanctioned as on 31 March 2011.
  • Farmers Technology Transfer Fund (FTTF) – 512 innovative projects in 27 states with grant assistance of 44.97 crores were sanctioned during 2010-11.
  • There were more than 69.53 lakh savings linked SHGs and more than 48.51 lakh credit linked SHGs covering 9.7 crore poor households as on 31 March 2011, under the microfinance programme.

Don’t Miss: NABARD Collaborates with Germans on SPRFS

Organisational Structure of NABARD:
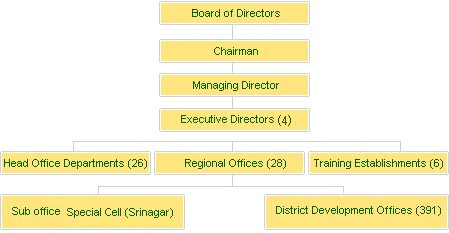
Reference: Official NABARD Website

Also, Read: 

PM Ujjwala Yojana: an LPG Scheme

Digital India (DI) Project : A Mission

Atal Mission for Rejuvenation and Urban Transformation (AMRUT)
South Asian Association for Regional Cooperation (SAARC)

0
India, Maldives, Pakistan, Bangladesh, Sri Lanka, Bhutan, Nepal, and Afghanistan constituted an organisation known as South Asian Association for Regional Cooperation, on the recommendation of Dhaka Conference on December 7-8, 1985. Its headquarter has been established in Kathmandu. A conference of the head of countries is held every year but conferences were generally delayed for the one reason or the other. The mutual misunderstanding among member nations has created a big question mark in achieving its objectives.
The sixteenth summit was held in Thimpu, Bhutan on 28–29 April 2010. Bhutan hosted the SAARC summit for the first time. This was marked the silver jubilee celebration of South Asian Association for Regional Cooperation that was formed in Bangladesh in December 1985. Climate change was the central issue of the summit with summit’s theme “Towards a Green and Happy South Asia”. Outcome of Thimpu Summit regarding climate change issue:
  • South Asian Association for Regional Cooperation leaders signed SAARC Convention on Cooperation on Environment to tackle the problem of climate change.
  • The SAARC nations also pledged to plant 10 million trees over the next 5 years.
  • India proposed setting up of climate innovation centers in South Asia to develop sustainable energy technologies.
  • India offered services of India’s mission on sustaining the Himalayan Ecosystem to the South Asian Association for Regional Cooperation member states saying that the initiative could serve as a nucleus for regional cooperation in this vital area.
  • India announced “India endowment for climate change” in South Asia to help member states meet their urgent adaption and capacity building needs posed by the climate change.
  • The seven-page ‘Thimphu Silver Jubilee Declaration-Towards a Green and Happy South Asia’ emphasised the importance of reducing dependence on high-carbon technologies for economic growth and hoped promotion of climate resilience will promote both development and poverty eradication in a sustainable manner.
Seventeenth SAARC Summit is to be held in Male, Maldives between 10-11 November 2011. The theme of 17th Summit has been declared as ‘Building Bridges’. “Building Bridges – both in terms of physical connectivity and figurative political dialogue. However, the notion of bridging differences would be represented as the overarching theme of the summit rather than any set diplomatic or development aims,”
Don’t Miss: 

G-8 (Formerly G-7)

0
G-7 was an organisation of seven non-socialist countries which were highly industrialised in the world G-7. included USA, Canada, Germany, Britain, France, Italy and Japan. After opting free market policies in the economy, Russia was also made the member of the organisation on June 21, 1997. At present, it is known as G-8.
The first G-7 summit was held at Rambouillet near Paris in November 1975. Initially,only five industrialised countries – USA, UK, West Germany, France, and Japan were its members. Later on, Canada and Itlay also joined it in 1976. Currently, G-8 countries include Britain, Canada, France, Germany, Italy, Japan, Russia and United States. The member countries of G-8 account for a 49% of global export, 51% of industrial output and 49% of the assets in the International Monetary Fund.
The 32nd annual summit of G-8 countries held between July 15-17, 2006 at St. Petersburg (Russia). Energy security topped the agenda of the G-8 summit along with education and fight against infectious diseases.
The 33rd G-8 summit took place in Hellingendomm (Germany) between 6-8 June 2007. Five big developing countries India, China, Brazil, Mexico and South Africa was invited in this summit.
The 34th G-8 summit took place in Tokyo on the northern island of Hokkaido, Japan from July 7-9, 2008.
The 35th G8 summit took place in the city of L’Aquila, Abruzzo, Italy on July 8–10, 2009.
The 36th G8 summit was held in Huntsville, Ontario in Canada, from June 25 to June 26, 2010. In this year’s meeting, the G8 leaders agreed in reaffirming the group’s essential and continuing role in international affairs and “assertions of new-found relevance.” The form and function of the G8 were reevaluated as the G-20 summits evolved into the premier forum for discussing, planning and monitoring international economic cooperation.
The 37th G8 summit was held between 26–27 May 2011 in the commune of Deauville in France.
Group of 20 (G-20)
  • The finance ministers of G-7 countries in September 1999 established G-20 as an international forum to promote informal dialogue and cooperation among systematically important countries within the framework of Batton Woods institutional system with a view to preserving international financial stability.
  • An important distinguishing characteristic of the G-20 from the G-7 is its broader participation from among both the industrialised countries as well as key emerging markets, thereby representing a wider range of view points.
  • Members of the G-20 are: Argentina, Australia, Brazil, Canada, China, France, Germany, India, Italy, Japan, Indonesia, Mexico, Russia, Saudi Arabia, South Africa, South Korea, Turkey, United Kingdom, United States, and the chairman country of European Union.
  • During the inaugural meeting of the G-20 held in Berlin during December 15-16, 1999, the group deliberated on various prerequisites for a sound international financial system and highlighted the importance of the following initiatives to avert the global financial crisis.

Don’t Miss: IMPORTANT SUMMITS

  1. Formulation of sound national economic and financial policies.
  2. Strengthening of the national balance sheet.
  3. strengthening of sovereign debt management.
  4. Greater attention to the impact of government policies on borrowing decisions of private firms.
  5. Sustainable exchange rate regime supported by consistent exchange rate and monetary policy.
  6. Widespread implementation of codes and standards including transparency, data dissemination, and financial sector policy.
  7. Measures to strengthen domestic capacity, policies and institutions.
  • The group welcomed the work of Bretton Woods Institutions and other bodies in the area of codes and standards and agreed to undertake the completion of Reports on Observance of Standard & Codes and Financial Sector Assessments.
  • The group affirmed its commitment to progress towards multilateral trade liberalisation within WTO framework.
Also, Read:

Nobel Prize Winners in Economics

2
Nobel Prize Winners in Economics
Introduced in 1967 but first prize was given in 1969. The Sveriges Riksbank Prize in Economic Sciences in Memory of Alfred Nobel has been awarded 43 times to 69 Laureates between 1969 and 2011.

Why are the Nobel Prize Winners in Economics Sciences called Laureates?
The word “Laureate” refers to being signified by the laurel wreath.

In Greek mythology, the god Apollo is represented wearing a laurel wreath on his head. A laurel wreath is a circular crown made of branches and leaves of the bay laurel (In latin: Laurus nobilis). In ancient Greek laurel wreaths were awarded to victors as a sign of honour – both in athletic competitions and in poetic meets.

Nobel Prize Winners in Economics

Year Winner Field
1969 Ragnar Frish
Joan Tinbergen
Dynamic Econometric Model of Growth
1970 Paul Samuelson Contribution in Economic Analysis
1971 Simon Kuznets Modern Economic Growth Analysis
1972 Kenneth Arrow
John Hicko
General Equilibrium and Welfare Economics
1973 W.W. Leontief Input-Outpur Model
1974 Gunnar Myrdal
F. Von Hayek
Contribution in Growth Economics
1975 Tjalling Koopmans
Leonid Kontarovich
Optimum Resource Allocation
1976 Milton Friedman Monetary History and Consumption Analysis
1977 James Meade
Bertel Ohlin
Internation Trade and Capital Flow
1978 Herbert Simon Decision Process in Organisations
1979 T. Shultz Arthur Lewis Economic Growth in Backward Nations
1980 Corienz Klein Model Related to Eonomic Fluctuation
1981 James Tobin Analysis of World Financial Market
1982 George Stigler Public Regulation
1983 Gerald Debrew Modification in General Equilibrium Analysis
1984 Richard Stone National Income Accounting System
1985 Franco Modigliani Financial Market and Saving Analysis
1986 James Boochanan Economic and Political Decision Making
1987 Robert T. Solow Economic Growth Model
1988 Moris Allies Optimum Utilisation of Resources
1989 H. Trigway Use of Probability Theory in Economics
1990 Harry Marco Vitz
William Sharp M. Miller
Portfolio Choice Principle, Capital Asset Pricing Model and Principle of Corporate Finance
1991 Ronald Coase Transaction Costs and Property Rights
1992 Gerry Backer Micro Economic Analysis of Human Behaviour
1993 Robert Fogal
Douglas North
Quantitative Methods in Economic History
1994 Joah Harsanyee
John Nash, R. Selton
Theory of non-operative games
1995 Robert Lucas Development of Rational Expectations Theory
1996 James Mirillis
William Vickrey
Incentive Structures Analysis
1997 Robert C. Merton
M. S. Scollas
Derivative and Stock Operations
1998 Amartya Sen Welfare Economics
1999 Robert Mundell Analysis of Monetary and Financial Policy in Exchange Rate System
2000 James Heckman
Daniel Macfaddan
For developing solution to solve decision making problem
2001 George A. Akerlof
A. Michael Spence
Joseph E. Stiglitz
Developing theories about financial markets that can be applied to both developing and advanced countries
2002 Daniel Kahnemann Vernon
L. Smith
Human Judgment and Decision Making under Uncertainity
2003 Robert Engle
Clive Granger
Methods analysing economic time series with time-varying volatility and common trend
2004 Finn Kydland
Edward Prescott
Banks and explaining business cycles
2005 Thomas C. Schelling
Robert J. Aumann
Game Theory Analysis
2006 Admund Phelps International Trade-off between inflation and unemployment
2007 Leonid,Hurwicz,
Eric Maskin,
Roger Myerson
Mechanism Design Theory
2008 Paul Krugman New Trade Analysis Theory
2009 Elinor Ostrom
Oliver E. Williamson
Analysis of economic governance, especially the boundaries of the firm
2010 Peter A. Diamond
Dale T. Mortensen
Christopher A. Pissarides
Analysis of markets with search frictions
2011 Thomas J. Sargent
Christopher A. Sims
Empirical research on cause and effect in the macroeconomy

Read Also: 

Wolf Prize (2015) in Science

Nobel Prizes Facts

List of First in India

Accounting Profit Vrs Economic Profit

0

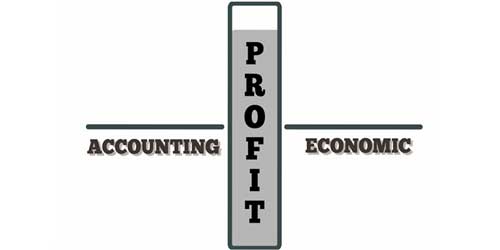
Meaning of Profit- Profit means different things to different people. “The word profit has the different meaning to businessmen, accountants, tax collectors, workers, and economists and it is often used in the loose polemical sense that buries its real significance”[Joel Dean, Managerial Economics, Asia Publishing House, 1960 p3]. In General sense ‘profit’ is regarded as income accruing to the equity holders, in the same sense as wages accrue to the labour; rent accrues to the owner of rentable assets; and interest accrues to the money lenders. To a layman, profit means all income that flows to the investors. To an accountant ‘profit’ means the excess of revenue overall paid-out costs including both manufacturing and overhead expenses. It is more or less the same as ‘net profit’. For all practical purposes profit or business, income means profit in accountancy sense plus non-allowable* expenses. Economist’s concept of profit is of ‘Pure Profit’ called ‘economic profit’ or ‘just profit’. Pure profit is a return over and above the opportunity cost, i.e., the income which a businessman might expect from the second best alternative use of his resources.

Accounting Profit Vs. Economic Profit
The two important concept of profit that figure in business decisions are ‘Economic Profit’ and ‘Accounting Profit’. It will be useful to understand the difference between the two concepts of profit. As already mentioned, in accounting sense the profit is the surplus of revenue over and above all paid-out costs, including both manufacturing and overhead expenses. Accounting profit may be calculated as follows:
Accounting profit = TR – (W+R+I+M)
where W = wages and salaries, R = rent, I = interest, and M = cost of materials.
Obviously, while calculating accounting profit, only explicit or book costs, i.e., the cost recorded in the books of accounts, are considered.
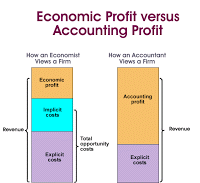
The concept of ‘economic profit’ differs from that of ‘accounting profit’. Economic Profit takes into accounts also the implicit or imputed costs. The implicit cost is the opportunity cost. Opportunity cost is defined as the payment that would be ‘necessary to draw forth the factors of production from their most remunerative alternative employment.’ Alternatively, the opportunity cost is the income foregone which a businessman could accept from the second bast alternative use of his resources. For example, if an entrepreneur uses his capital in his own business, he foregoes interest which he might earn by purchasing debentures of other companies or by depositing his money with joint stock companies for a period. Furthermore, If an entrepreneur uses his labour in his own business, he foregoes his income (salary) which he might by working as a manager in another firm. Similarly, by using productive assets (land and building) in his own business, he sacrifices his market rent. These foregone incomes – interest, salary and rent – are called opportunity cost or transfer cost. Accounting profit does not take into account the opportunity cost.
It should also be noted that the economic or pure profit makes provision also for (a) insurable risks, (b) depreciation, and (c) necessary minimum payment to share holders to prevent them from withdrawing their capital. Pure profit may thus is defined as ‘a residual left after all contractual costs have been met, including the transfer cost of management, insurable risks, depreciation, and payment to share holders sufficient to maintain investment at its current level.’ Thus,
Pure Profit = Total Revenue – (Explicit Cost + Implicit Costs)
Pure profit so defined may not be necessarily positive for a single firm in a single year – it may be even negative since it may not be possible to do decide beforehand the best way of using resources. Besides, in economics pure profit is considered to be a short-term phenomenon – it does not exist in the long run, especially under perfectly competitive conditions.
*for example Indian Income Tax Act makes only partial allowance for expenses on ‘entertainment and advertisement’.
Don’t Miss: